Units of measurement, symbols, significant digits and rounding off
1.1 Units of measurement and symbols
1.2 Significant digits
1.3 Rounding off
1.4 Bias, accuracy and precision
Individual Trees and Logs
2.1 Bole characteristics
2.1.1 Diameter
2.1.2 Height
2.1.3 Bark thickness
2.1.4 Volume
2.1.5 Stem form and taper
2.2 Log characteristics
2.2.1 Diameter
2.2.2 Length
2.2.3 Volume
2.2.4 Weight
2.2.5 Allowance for defect
2.3 Crown characteristics
2.3.1 Width
2.3.2 Depth
2.3.3 Surface area
2.3.4 Volume
2.3.5 Biomass
2.4 Stem analysis
Groups of Trees (Stands)
3.1 Number of trees
3.2 Diameter
3.3 Basal area
3.3.1 Fixed-area plots
3.3.2 Angle count sampling
3.3.3 Advantages and disadvantages of angle count sampling
3.4 Height
3.4.1 Mean height
3.4.2 Predominant height, top height, dominant height
3.4.3 Stand height curve
3.5 Volume
3.6 Crown closure
3.7 Crown biomass
3.8 Growth and increment
References
Appendix 1: Checklist of equipment and materials
[RWG#2] [Copyright] [Title Page] [Next Page] [Last Page]
3.4.3 STAND HEIGHT CURVE
A stand height curve (SHC) is the curve of best fit to a series of points generated by plotting h against d (or g) for some or all trees in a stand. In even-aged stands, the trend of the curve is usually apparent but not well defined because, within any diameter class, the height of individual trees may vary considerably due to genetic differences and differences in point density (affects d but has little effect on h). The trend is better defined by plotting class means of d and h against each other. The relationship invariably is curvilinear and concave to the abscissa (Fig. 3.1).
Figure 3.1: Example of a Stand Height Curve
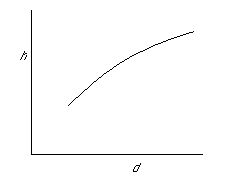
The curve is steep for young crops on good sites and near flat and linear for old crops and crops on poor sites (height growth arrested but diameter growth still active). With time, the relationship moves upwards and to the right, the movement being governed by the relative growth rates of d and h over time.
The SHC partly describes stand structure and is important to the silviculturist. It is useful in one method of deriving stand mean height (see Sect. 3.4.1) and in extension work for estimating stand volume in conjunction with a reliable 2-way volume function.
3.4.3.1 Sampling for the Stand Height Curve
The size of sample (number of trees) required to establish a reliable SHC depends on the size and variability of the population. Normally, 50-100 trees suffice for a compartment of up to 20 ha of even-aged plantation forest, and 10-20 trees for sample plots of area 0.1 - 0.2 ha.
The sampling designs used to provide data for establishing the stand height curve include simple random, stratified random, systematic with a random start, and subjective sampling.
1. Simple random sampling
This design is not often favoured owing to poor precision but satisfactory results have been reported in some applications, e.g. see Arabatzis and Burkhart 1992.
2. Stratified random sampling
Generally, this design is the most efficient. The d classes derived from a stand enumeration (partial or complete) are used as the strata, and distribution of the sample is weighted proportional to relative class frequency, e.g. consider Table 3.3. for an example of stratification by stem diameter.
Table 3.3 Selecting a Sample of (Say) 15 Trees from a Sample Plot for Establishing a Stand Height Curve
3. Systematic sampling with a random start
This design is simple to apply and is appropriate particularly when time and money are limiting. Take, for example, the sample plot represented by Table 3.3. Here we have 85 trees from which 15 trees, i.e. 1 tree in every 5.7 trees, are to be selected for establishing the stand height curve. An appropriate procedure is:
- Select a random number from the range 1 to 6 (6 is the absolute value of 5.7). Suppose that the number is 4.
- From the plot starting point, locate the 4th tree and measure it for height (and for diameter if not done already).
- Also measure for height (and diameter if not done already) the 10th (4+5.7), 15th (4+5.7x2), 21st, ........ , 78th, and 84th (4+5.7x14) trees.
- Establish the stand height curve by fitting a curve mathematically to the data (see Sect. 3.4.3.2 below) or by hand plotting (h vs d).
Subjectively choosing the trees to be sampled may be justified if the forest plot is small and the assessor is experienced and knows the species well. It is sometimes useful in extension work, e.g. when a forest owner requires a quick, low cost appraisal of a stand, but the danger of bias is always present.
3.4.3.2 Fitting the Stand Height Curve
Fitting stand height curves free-hand was common practice until the advent of hand-held field computers made it possible to fit reproducible curves quickly and accurately in the field. An excellent fit is often achieved with models of the form
- log(h) = a + b log(d)+ e
- log(h) = a + b (1/d ) + e
- h = a + b log(d) + e
- Y = a + b/d + e
where Y = (1/(h -K))0.4
K = height of d above ground, i.e. 1.3 m,
- h = a + b(1/d) + e
- h = adb + e
- h = aeb/d + e
- h = a + bd + cd 2 + e
where a, b, c are regression constants, e is the base of Naperian logs, and e is the error term.
It is difficult to establish a satisfactory relationship between total height, h, and d in uneven-aged (native) forests in Australia, but in some situations one between merchantable height, hm, and d may be possible and useful. If such a relationship can be established and be shown to be reliable and constant over time (mature stands), hm need be measured the first time only in periodic management inventory. This has the advantage of reducing errors in the estimate of volume increment because errors in the measurement of hm will be held constant and differences of opinion between assessors on the merchantable limits of trees will be eliminated.