Units of measurement, symbols, significant digits and rounding off
1.1 Units of measurement and symbols
1.2 Significant digits
1.3 Rounding off
1.4 Bias, accuracy and precision
Individual Trees and Logs
2.1 Bole characteristics
2.1.1 Diameter
2.1.2 Height
2.1.3 Bark thickness
2.1.4 Volume
2.1.5 Stem form and taper
2.2 Log characteristics
2.2.1 Diameter
2.2.2 Length
2.2.3 Volume
2.2.4 Weight
2.2.5 Allowance for defect
2.3 Crown characteristics
2.3.1 Width
2.3.2 Depth
2.3.3 Surface area
2.3.4 Volume
2.3.5 Biomass
2.4 Stem analysis
Groups of Trees (Stands)
3.1 Number of trees
3.2 Diameter
3.3 Basal area
3.3.1 Fixed-area plots
3.3.2 Angle count sampling
3.3.3 Advantages and disadvantages of angle count sampling
3.4 Height
3.4.1 Mean height
3.4.2 Predominant height, top height, dominant height
3.4.3 Stand height curve
3.5 Volume
3.6 Crown closure
3.7 Crown biomass
3.8 Growth and increment
References
Appendix 1: Checklist of equipment and materials
[RWG#2] [Copyright] [Title Page] [Next Page] [Last Page]
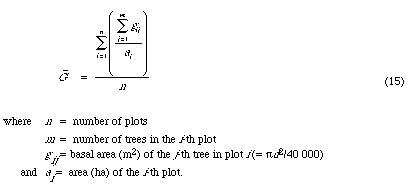
3.3.1 DERIVING G - USING FIXED-AREA PLOTS
Measure d of each tree in each sampling unit (circular, rectangular or square plots) and derive G - from the formula:
Sampling for G - using fixed-area plots is not as precise or efficient as sampling using ACS (see Palley and O'Reagan, 1961; Kulow, 1966; Whyte and Tennent, 1975) because when a population mean depends more on the size of large compared with small units, it is more efficient to select the larger units with greater probability. This is done using a technique called PPS Sampling, i.e. sampling with a Probability Proportional to Size. ACS is one form of PPS sampling.