
Forest Inventory.
|
|
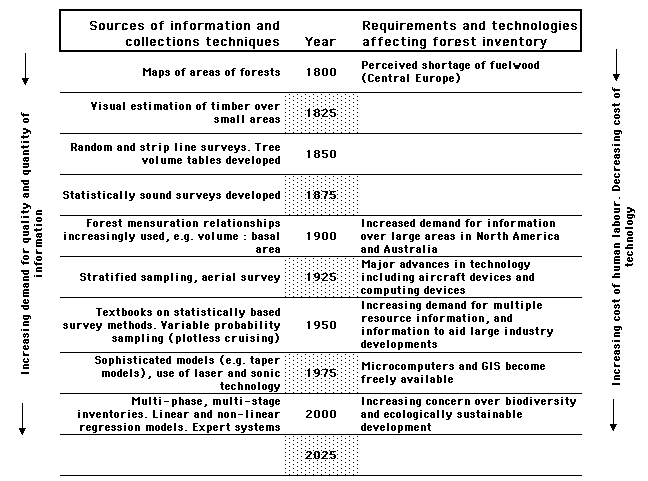
A brief history of forest inventory Forest Inventory. |
    |
|
|
Extract from Brack (1997) |
Systematic collection of forest information began in Europe towards the end of the Middle Ages, i.e. in the late 18th Century. A growing concentration of people into towns and relatively dense population centers lead to a fear that fuelwood resources from accessible forests would be exhausted. The first forest maps were made to assist planning and management of this scarce resource. These maps delineated the location of forests by area. Such information was adequate for estimating total growing stock (biomass) which was sufficient for planning fuelwood utilisation. By the beginning of the 19th Century, foresters in central Europe were ocularly estimating the volume and stocking of small forest areas (Forstorte). These ocular estimates were effective if the area could be surveyed as a whole from one spot (Pfeil, 1858).Whole forests were divided into Forstorte and the sum of the ocular estimates for each was used to determine the forest resource levels. This approach continued to provide adequate information for planning in the State Forests of Saxony until the early 1940's (Loetsch and Haller, 1964, p. 7). The main requirement for collecting effective information was the existence of a body of workers with sufficient experience and knowledge to reliably estimate timber resources on small areas, and sufficient time to visit all the Forstorte. Workers skilled in ocular estimation were in great demand. Throughout the 19th Century, mensurational techniques and relationships were developed and improved. Relationships between simple to measure parameters (e.g. diameter and height or length) and parameters of interest (e.g. volume) were found and published (e.g. Hoppus's Practical Measurer (c. 1840) and the tree volume to basal area relationship (Carron, 1968) ). These relationships allowed foresters to conduct strip line surveys over forest areas much larger than the Forstorte, e.g. Matern (1982) describes random and strip line surveys in the 1830's and 1840's. By the turn of the century, the surveys had developed into statistically sound sample-based methods, e.g. Schmidt (1891) describes a valid plot-based method used in Germany. Schreuder et al. (1993, p. 10) note that these statistically sound approaches, and discussions about the need for representative samples in forestry literature, predate the major theoretical publications in the field of statistics. During the 19th Century, developments in collecting information about forest resources were based on experience, early statistical knowledge and simple mensuration relationships. These developments were appropriate to collections relating to small units of forest. In contrast, developments in the 20th Century were dominated by technological changes and an increase in the size of the forest units of interest. With the opening up of the North American and Australian continents, information about large forest estates was required - the Forstorte or small sample unit was not appropriate. Remarkably advanced stratified sampling was being practised by 1911 (Schreuder et al. 1993, p. 11) and by the 1920's developments in aircraft use allowed aerial surveys to be pioneered in Canada. By the middle of the 20th Century, the statistical basis for multi-phase and multi-stage forest inventory was firmly established and textbooks discussing the theory and practice of statistical survey techniques were freely available (e.g. Schumacher and Chapman 1942). Unequal probability sampling theories and practices in forestry were also developed during this period (Bitterlich 1947). The development of unequal probability sampling in forestry practice was made prior to its introduction in the statistical literature. Combining these efficient sampling theories with the increasingly powerful and available computing and remote sensing technology has allowed the development of sophisticated forest sampling systems. For example Sandoval et al. (1994) successfully combined two-stage and two-phase sampling with regression estimators in a large area inventory of natural forest in Chile. Hazard et al. (1994) designed a four-phase inventory system using Landsat satellite imagery, high-altitude colour infrared photography (1:60 000 scale), low-altitude colour infrared photography (1:3000 scale) and ground sampling for an inventory in Alaska. Unfortunately further technological developments may still be needed as Hazard et al. conclude that although the four-sampling strategy is a good one, it is several years ahead of the current supporting technology. |
Graphical History
 |
| Where to now? |
As the above illustrates, forest managers have been formally collecting information about forest resources for almost two centuries. In fact, foresters were using "advanced" statistical concepts and approaches before their major theoretical publications in the field of statistics. Over the past 2 centuries the need for information has grown, i.e. forest managers need to know more about a wider range of parameters. The information is also required to be more precise and needs to be collected with increasingly expensive human labour. One method of improving precision is by increasing the number of samples taken. However this generally requires a major increase in funds and other approaches may be utilised:
|

|
[history.htm] Revision: 6/2000 |