
LiDAR Biomass Estimation Project
Overview
Principle
Investigators
Alex Lee (ANU)
Richard Lucas (UWA)
Introduction
This project is being undertaken as PhD research at
the ANU School of Resources Environment and Society (SRES). SRES and the ANU have provided a scholarship
for the term of the PhD and the CRCGA have provided top-up funding for
operational costs. This project has resulted
from the initial investigations under the CRCGA Project 2.4 – Remote Sensing of
Biomass project. See here for further information on this initial project <link>.
The primary aim of the thesis is to develop and evaluate
algorithms for consistently and accurately quantifying the above ground biomass
and structure of forests and woodlands using small footprint airborne scanning
laser (LiDAR). The utility of LiDAR for estimating biomass and structural
attributes is being examined across a range of scales; from within plot
structural variability to broad structural types across environmental
gradients. The research methodology is
undertaken in three phases.
v
Phase 1 establishes
that a simple and robust application of LiDAR data for above ground biomass
estimation can be rapidly applied at a plot scale across landscape level
amounts of LiDAR.
v
Phase 2 seeks to
understand the forest structural components that are interacting within the plot,
to provide insight into how the plot based biomass estimates are being
generated.
v
Phase 3 develops the
results from Phase 2 into a refined and robust stand based LiDAR derived
biomass model, with a potential output being a biomass surface that can be
generated and reported at a range scales and across diverse environments.
My supervisory panel is
Dr Brian Lees, Dr Brendan Mackey, and Dr Cris Brack. I also have access to specialist advisors in Dr Richard Lucas
(UWA) and Dr David Jupp (CSIRO). The
PhD research began in 2003 and is anticipated to be complete in late 2005.
Methods
What
is LiDAR?
Fine spatial resolution remote
sensing, such as airborne scanning laser, otherwise known as LiDAR (LIght
Detection and Ranging), offers the potential to generate field plot equivalent
forest measures for some attributes over a much wider area than with field
plots alone. Small footprint LiDAR is
an active sensor that uses a laser beam in the near infrared spectral range
directed towards the ground. The time
and intensity of any return signals from the original pulse are used to measure
the distance to an object. When
combined with GPS and aircraft inertial navigation technology, this system
provides a highly precise, point dataset of terrain and vegetation (Jupp &
Lovell, 2000). Depending upon flying
height, the footprint size may vary from 0.1 to 5.0m and the interval between
laser returns may range from 0.25 to 5m (see Figure 1). With the aid of real-time GPS and
sophisticated inertial navigation systems (INS) that compensate for aircraft
pitch, yaw and roll, most LIDAR are now capable of achieving absolute spatial
accuracies of < ± 1m in the x and y directions, and < 0.25 m in the z
direction (i.e., elevation).
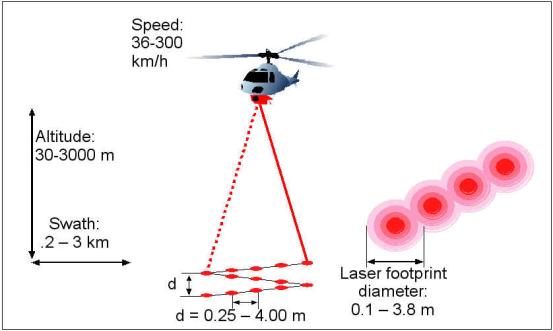
Figure 1: Graphical representation of the various elements of a small footprint
airborne scanning laser (LiDAR) system.
Study Area & Data collection
To
estimate stand level (i.e. 0.1-1ha) structural variation as observed by small
footprint LiDAR across a range of environments, data from two different forest
measurement pilot projects are combined (see Figure
2). The first
project undertook data collection in 2000, and concentrated on a 222,000ha
study area in the south central Queensland forest and woodlands, funded by the
CRC Greenhouse Accounting (Tickle, et al 2001) and an ARC SPIRT research grant (Lucas, et al,
2001). Here 1,100ha of LiDAR was collected using a sampling
scheme with a systematic grid layout, based around 150 Primary Sampling Units
(PSU) of 7.5ha size (500m x 150m), spaced 4km apart. Each PSU was made up of 30 Secondary Sampling Units (SSU) 0.25ha
(50x50m) in size. From the 4,500 SSU's
31 field plots were selected, (plus 3 smaller (10x10m) "regrowth"
plots) where biomass estimates were made using a combination of destructive
harvesting and application of allometric equations. Field sites were selected through a stratified random sampling
scheme, which sampled across broad community and structural types, as well as
imposing accessibility criteria (see here for further information on the study
site <link> and data collected <link>).
The
second project collected data in 2003 as part of a National Forest Inventory
(NFI) Continental Forest Monitoring Framework (CFMF) pilot project in North
East Victoria. LiDAR data collection
produced a continuous transect 400m wide and approximately 1,485km long,
resulting in 59,400ha of LiDAR data collected (4% of the study area), with over
1 billion individual data points (BRS, 2003)
Click here for further information <CFMF
NFI website link>.
|
|
|
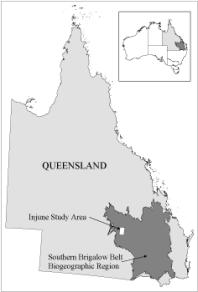
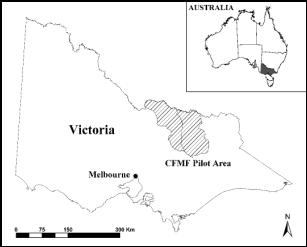
Figure 2: Location maps
for the central Queensland and NE Victorian study areas.
LiDAR collected at
both study areas averaged a return spacing of one metre, though some plots in Victoria
were over-flown multiple times. The
average number of returns per field plot was 4,000, with a range from 150 to
9,000, depending on the plot size and acquisition technique. The laser footprint size was 0.09m for
Queensland, and 0.24m for Victoria. The
data was supplied as first and last returns, pre-processed into ground and
non-ground returns using the survey company’s proprietary software. The Queensland study area had 30 field plots
co-incident with LiDAR, with an additional two regrowth plots. The 22 NE Victorian plots co-incident with
LiDAR were 30x30m. On all field plots,
every tree 10cm+ diameter at breast height (DBH) was measured with a range of
traditional attributes.
The LiDAR data was supplied as
text files, with X and Y coordinates, elevation (height above sea level) and
intensity values. This data was
imported into ESRI database table format and the XY coordinates used to create
a spatial point coverage using AML (Arc Macro Language) algorithms. Ground returns are used to create a “bare
ground” modelled surface of approximately 1m2 resolution using
interpolation routines within the GIS.
Then each non-ground return is combined with the ground surface, and the
ground surface elevation is assigned to each of the non-ground returns. Subsequently the height above ground value
for each return is calculated as the difference between the non-ground return
elevation and ground elevation. The
vertical nature of LiDAR data can be displayed and utilised in a number of
ways, see Figure 3.

Figure 3: LiDAR representations for plot Queensland plot p81-11. (a) the raw
points profile across plot width, (b) an apparent vertical profile showing the
percentage of vegetation returns summed per 1m height interval, and (c) cumulative
height percentage curve. Arrows
indicate percentage of data used to derive heights for biomass estimation.
Research
Methods Outline
The primary hypothesis that is being tested is that
tree height, crown dimensions, and the density of foliage of all trees within a
plot relate to above ground biomass.
Because remote sensing data such as LiDAR can be used to measure these
variables then, if the method is robust, precise estimates of biomass can be
made over much larger areas (and with significant cost reductions) than with
utilising field plots alone.
Biomass estimation will
be undertaken in 3 phases.
1.
The first phase
establishes that a simple and robust application of LiDAR data can be rapidly
applied across landscape level amounts of LiDAR (in this case 1,125ha, or
approx 4 million vegetation returns in the Queensland dataset), using plot
scale (0.25ha) field based biomass estimates as calibration. The output will be a simple linear regression
model that utilises LiDAR derived height and cover estimates to give above
ground biomass at a plot scale across the landscape.
2.
Phase two seeks to
understand the forest structural components that are interacting within the
plot, to provide insight into how the plot based biomass estimates are being
generated. LiDAR derived forest
structural attributes will be validated with field data on a tree and plot
level, for both Queensland and Victorian datasets. The outputs will be simple linear regression model(s) that
utilise a range of LiDAR indices to give above ground biomass at a tree scale,
and an understanding as to how this might be scaled up to the stand and
landscape.
3.
Phase 3 develops the
results from Phase 2 into a rapid stand based LiDAR derived biomass model. A potential output of this model will be a
biomass surface, derived from a function of height and cover, that can be
generated and reported at a range scales, for example from 10x10m up to 400x400m
sizes. A linear regression model will aim
to be simple, robust across a range of environments and forest structures, and
rapidly applied across large amounts of data.
This model will then be validated in new regions that contain both field
and LiDAR data. A certain number of
Victorian field plots may be kept separate for validation purposes.
Results
Phase 1
Phase 1 has been substantially completed and shows
that LiDAR can produce estimates equivalent to those generated using
traditional field plots (r2 = 0.92, SE = 12 Mg ha-1) –
see Figure 4. Using data from 32 field
plots in the Queensland dataset, this method tested both forward and backward
stepwise linear regressions using LiDAR derived crown cover and 20 potential
height variables, based on 5% intervals of the LiDAR data. This interval was used as a compromise
between having a simple and robust model by being parsimonious with the number
of explanatory variables in the regression model, versus having enough
variables to describe the variability in height among strata. From this set, 6 height variables, and crown
cover were the most significant for estimating above ground biomass in the
Queensland forest and woodlands.
![]()
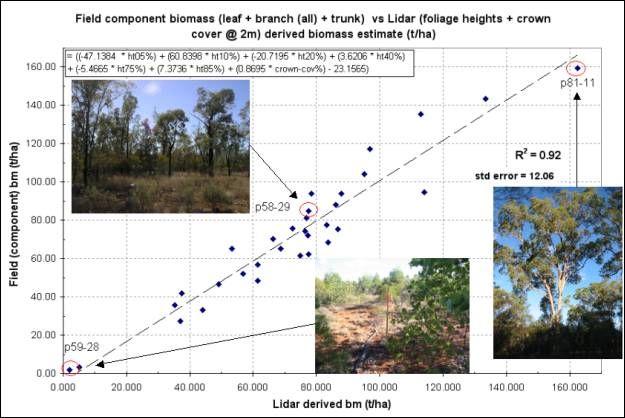
Figure 4: Field biomass estimates vs LiDAR
derived biomass estimates based on regression model outputs.
Phase 2
Phase
2 is currently developing 3D modelling methods of integrating LiDAR and field
tree data (see Figure 5) to determine above-ground forest biomass at tree and
stand scales. Algorithms are being
refined that enable automatic extraction of individual larger tree location and
dimensions, including
v
trunk locations,
v
crown dimensions
v
crown foliage density
(see Figure 6)
v
variability in
foliage height between canopy base and the top of the tree
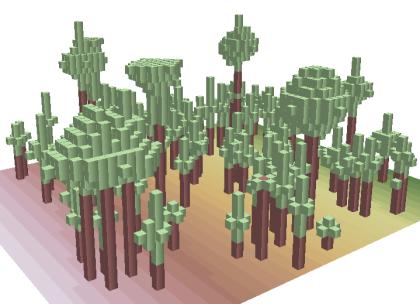
Figure 5: 3D ‘cubic’ modelling and
visualisation of field tree data from a mixed cypress pine & eucalypt plot
in the Queensland study area. The
common reference grid used to develop this model can incorporate both field
measurements and LiDAR data, for a direct comparison between the two sources of
information.
The research has also concluded that, for certain
forest measurements (e.g., height, cover), airborne LIDAR data can provide
information just as detailed as that measured in field plots, but over a much
larger area (both at tree and landscape scales).
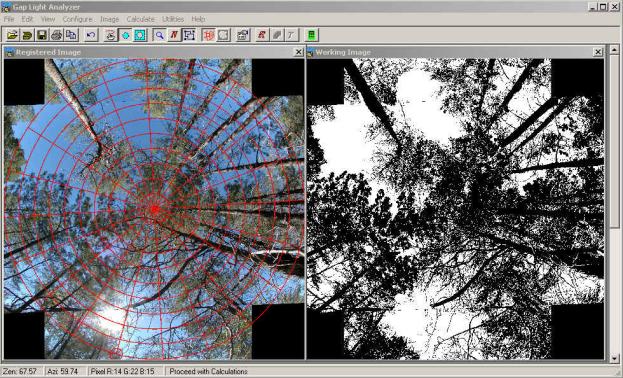
Figure 6:
Assessment of foliage cover using hemispherical photo analysis, for comparison
and validation with LiDAR return data, for crown (and stand) foliage density.
Phase 3
Preliminary planning for Phase 3 has indicated that forest biomass
estimates can also be further refined by integrating LiDAR-derived measures of
tree/foliage heights, crown and foliage cover, the number of trees, and the
relative amount of overstorey and understorey in a stand. This information also indicates the
potential successional phase of the woody area and, possibly the time period
since, and severity of the last major disturbance (for example, see Figure 7),
though this is subject to much variability and requires further validation.
|
|
|
|
|
|
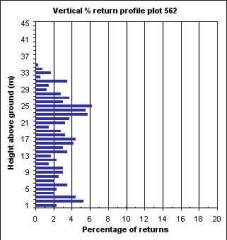

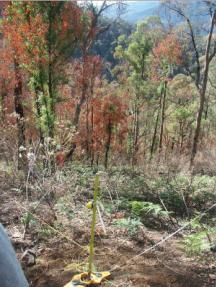

Figure 7: LiDAR apparent vertical profile showing the potential difference in
fire intensity between two Victorian high country plots on steep slopes. Left panel – plot 562, lesser intensity fire
impact, with understorey and lower canopy still present. Right panel – plot 558, more intense fire
impact, no understorey or lower canopy present and scorched crowns.
Further Information
Alex Lee
PhD Scholar
School of Resources, Environment & Society
Australian National University
Canberra
ACT 0200,
Australia
Email: alex.lee@anu.edu.au
Tel: +61 (2) 6125 0348
Fax:+61 (2) 6125 0746
For a list of Conference papers and presentations on the Publications page
References
Bureau
of Rural Sciences (2003) A Continental Forest Monitoring Framework for
Australia - Background, concept and rationale. Department of Agriculture, Fisheries and Forestry, Canberra.
Jupp, D., & Lovell, J. (2000) CSIRO Vegetation LiDAR Initiative VSIS and ECHIDNA: Product background and description for airborne (VSIS) and ground-based (ECHIDNA) canopy LiDAR systems. CSIRO EOC
Lucas, R.M., Tickle, P., Witte, C. and Milne, A.K. (2001). Development of multistage procedures for quantifying
the biomass, structure and community composition of Australian woodlands using
polarimetric radar and optical data. Proceedings,
IGARSS Symposium, Sydney, Australia.
Tickle, P. K., Lee, A., Austin, J., Witte, C.,
Lucas, R.M. (2001) Estimating the biomass and structural attributes of
Australian forests and woodlands using LiDAR and large-scale photography. In
Proceedings International Geoscience And Remote Sensing Symposium July
2001, Sydney, Australia. IGARSS 2001 Steering Committee, IEEE, Sydney.