
Forest Inventory.
|
|
Background statistics Forest Inventory. |
    |
| Statistics may be defined
as numerical facts that are systematically collected. It may also
be used to refer to the science of collecting, classifying, summarising
and using these numerical facts. Statistics can be used to describe a forest population in a consistant and repeatable manner - these are called descriptive statistics. When numerical facts are collected via a probability-based system (ie the probability of selecting an object for counting or measuring is known) then the science of statistics also allows predictions about the forest population to be made - these are called inferential statistics. Inferential statistics are generally based on a measurements from a subset (or sample) from a population of interest. |
Mean | The mean is descriptive statistic
that summarises the centre of a range of values. An unbiased estimate of the
mean size or value of a population is one of the most common objectives in
a forest inventory. A mean is defined as:  where:
|
Mode | The mode is a descriptive
statistic that identifies the value (in a list of values) with the highest
frequency. It is commonly used when the variables observed are ordinal
or nominal (eg presence or absence, classifications of damage or habitat
type). The mode may not be a unique value, for example when two or more values occur the same number of times. |
Median | The median is descriptive
statistic that summarises the middle of a range of values - half of the values
are less than the median while half are above. The data values are sorted into ascending (or descending order) and then the median is selected:
|
Variance Standard Deviation |
The variance and the standard
deviation are descriptive statistics that indicate the spread of individual
observations around the mean. In forest inventory, the usual measure of this
spread is the standard deviation: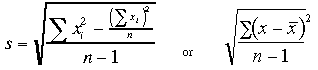 where:
The sample estimate of the mean and standard deviation can be used to make inferences about a population. For example, in a normal population, 68% of all individuals will be within s of the mean, i.e. 68% of the population lie within the range of  most of the time. 95% of individuals will be within 2 times the standard deviation
of the mean, almost all (99%) will be within 3 times the standard deviation
of the mean.
most of the time. 95% of individuals will be within 2 times the standard deviation
of the mean, almost all (99%) will be within 3 times the standard deviation
of the mean. If the population is not normally distributed, then at least the fraction  will lie within k*s of the
mean value. will lie within k*s of the
mean value. |
Coefficient of variation | The coefficient of variation
is a description of the relative variation in a population. You would expect,
for example, that the range of heights in a stand of tall trees would be greater
than the range in a stand of small trees. The coefficient of variation (CV)
removes this noise by expressing the variation as a percentage of the
mean value: The CV for volume/ha or stand basal area in a well managed plantation may be about 40%, while in a natural / native forest, the CV may exceed 100%. |
Sample size | The required output from
many inventories is an unbiased estimate of the mean size or value of a parameter
with an indication of the precision or reliability of that estimate. Thus,
the inventory designer must be able to provide an estimate of the mean value
and an estimate of the possible range of values that would occur if another
sample of the same size were taken. The range due entirely to the sample taken,
is termed the sampling error.
Often the desired precision of the inventory is determined in terms of the
sampling error. The number of samples required to meet this sampling error
is calculated as: where:
|
Standard Error (of an estimate) |
The standard error is a descriptive statistic that indicates the spread
of population variables around their own [Mean]. That is, if you are estimating
the mean of a population using a sample of n (randomly chosen) individuals,
then you could get a range of possible samples means from different samples
of n. The standard error of the mean is estimated as
Just as the sample estimate of the mean and standard deviation can be used to make inferences about the spread os individuals around the population mean, the standard error can be used to make inferences about the spread of all possible sample means around the true mean.. For example, for large sample sizes (n>30), 68% of all possible sample means will be withing Se of the population mean. Again, 95% of the possible samples will be within 2 times the standard error of the population mean, and almost all (99%) will be within 3 times the standard error of the mean. |
|
Activity  |
Try your skill at interpreting these basic statistics for real forest populations. |

|
[stats.htm] Revision: 6/2000 |